Caplena makes it easy to export your coded data so you can analyze, share, or report outside the platform. Whether you want a detailed row-by-row file or a high-level summary, you’re just a few clicks away.Documentation Index
Fetch the complete documentation index at: https://docs.caplena.com/llms.txt
Use this file to discover all available pages before exploring further.
Where to export from
You have two main options:- From the Topic Assignment view → export one open-ended question at a time.
- From the Data page → export the entire dataset with multiple questions at once.
The steps and options are basically the same wherever you export from. The only difference is how much data you get. When exporting from the Topics view, only the current text-to-analyze column will be included. To export all TTA columns, trigger the export from the Data page.
How to export
.gif?s=9e952eed82dcb6328b4efcb8bf01c8ff)
Select the Topic format
Choose one of the following formats:
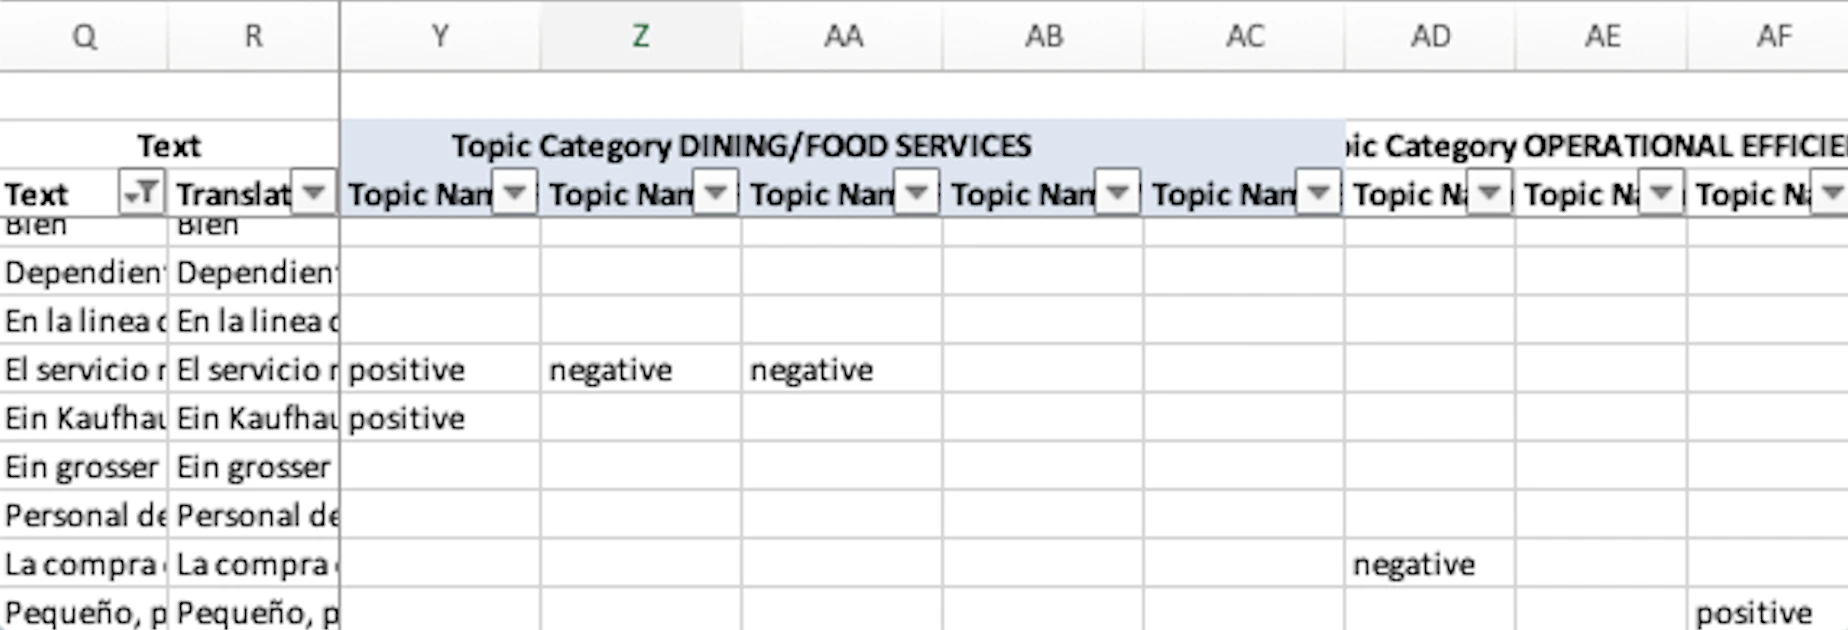
- Tabular format with a column per topic — For each record, topics are marked with their sentiment value (if enabled) in the corresponding column based on the occurrence of a given topic in the text.
- Topics in order of assignment — Topics are listed one after another in column placeholders in the order they were assigned in the topic view.
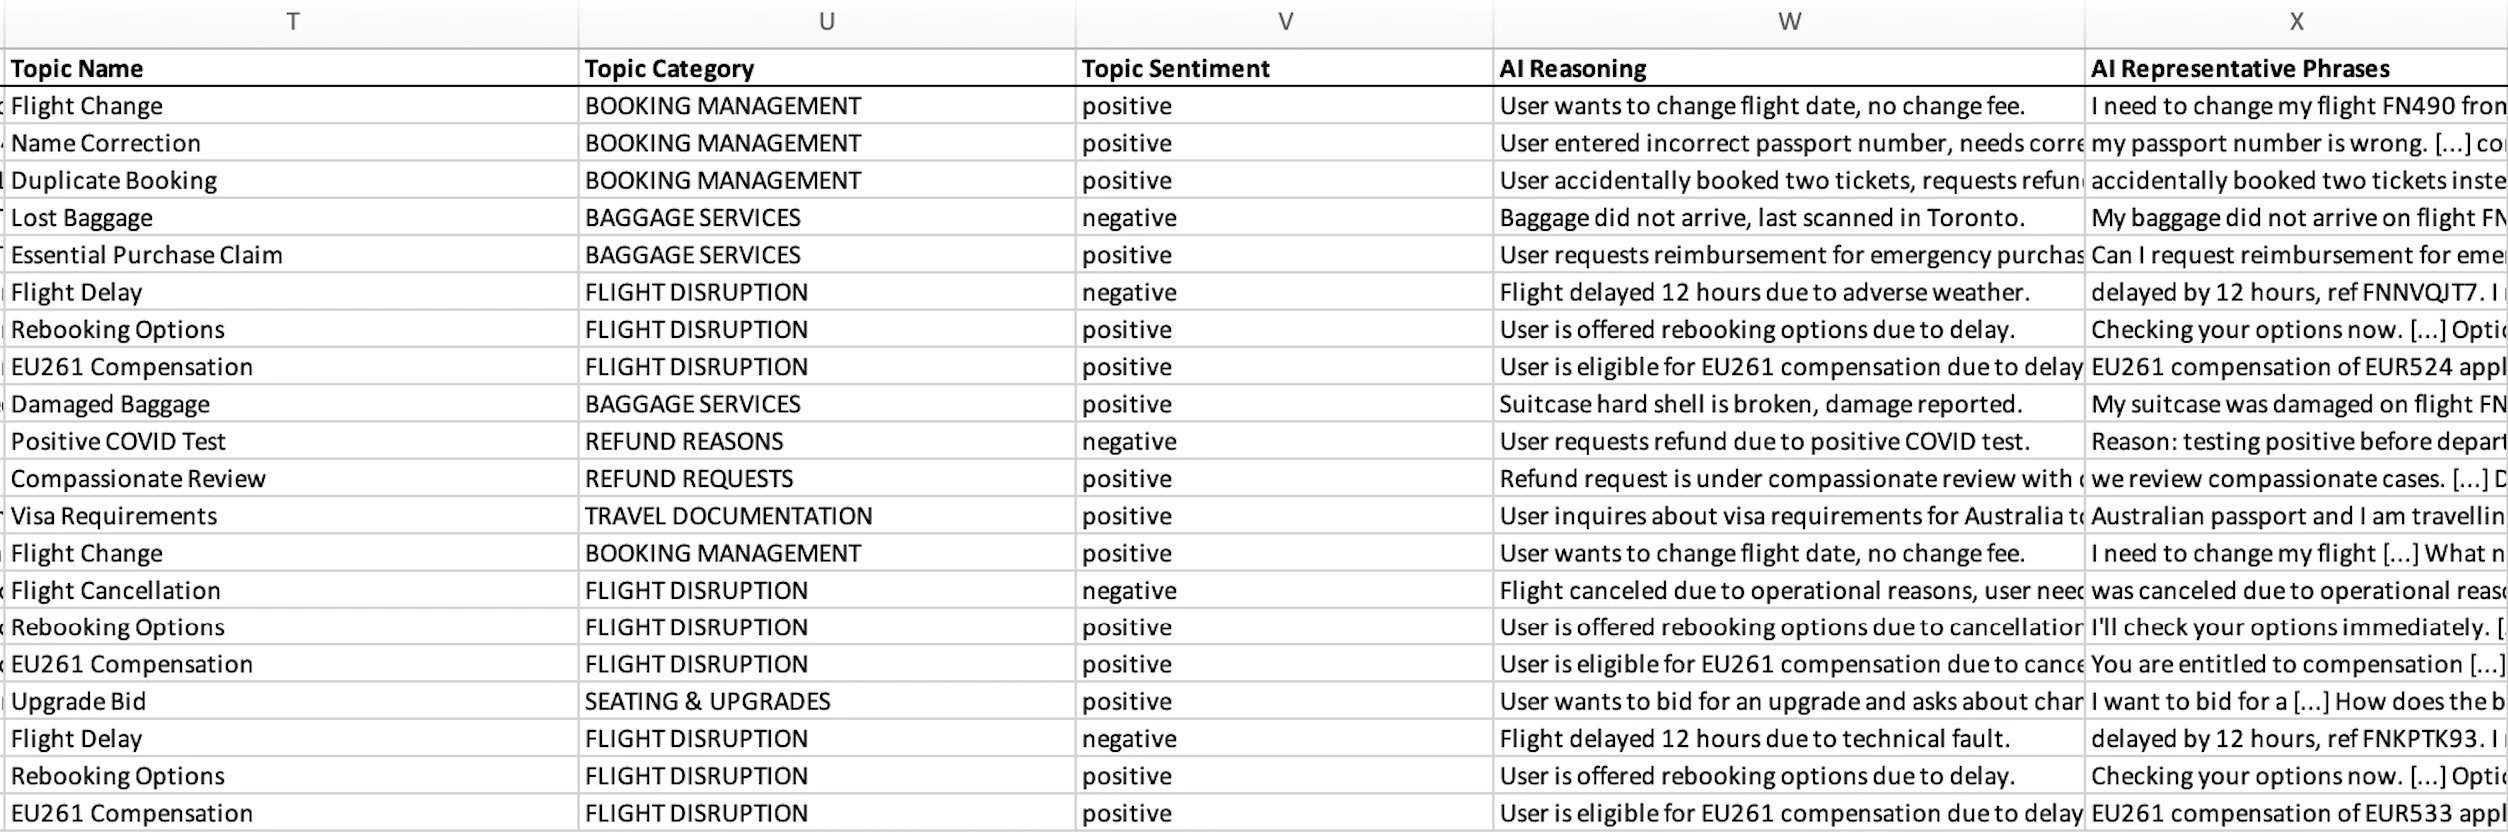
- Long format (easy-to-use for BI tools) — Each topic assignment gets its own row. Each row also includes:
- AI Reasoning — why this topic was assigned to this response
- AI Representative Phrases — the exact text span(s) from the response that triggered the assignment
Select data to download
Under Data to download, pick what you need:
- Additional columns (metadata you uploaded)
- Text (original responses)
- Translated text (if enabled)
- Topics
- Metadata (such as review status or highlighted in Caplena, etc.)
Optional: Advanced settings
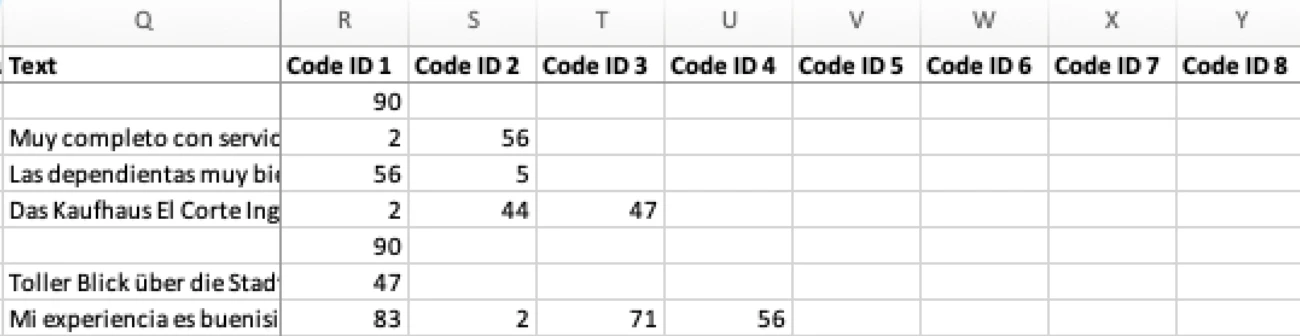
- Legacy format — Single header row; originally an older format for compatibility, but also allows you to export data with the numerical code so you can process it based on the unique numerical code with the topic collection.
- Add category columns — Adds a column for each category, showing whether a topic from that category is present.
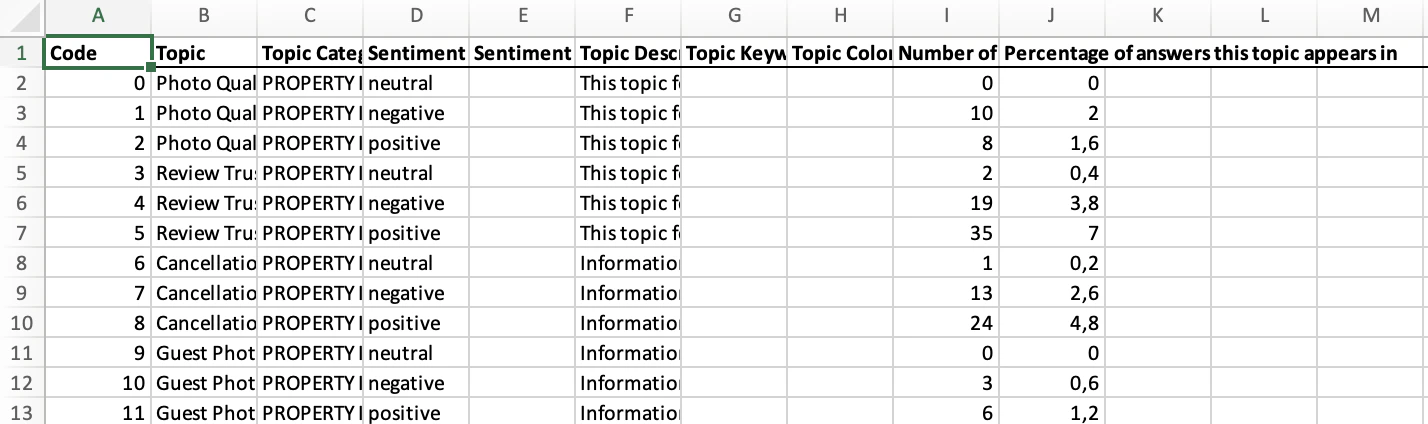
Exporting your Topic Collection summary
In addition to the row-level export, you can also export a Topic summary — a high-level overview of your topic collection. From the export dialog, click the Topic summary tab, select your preferred File type (e.g. Excel), and click Export.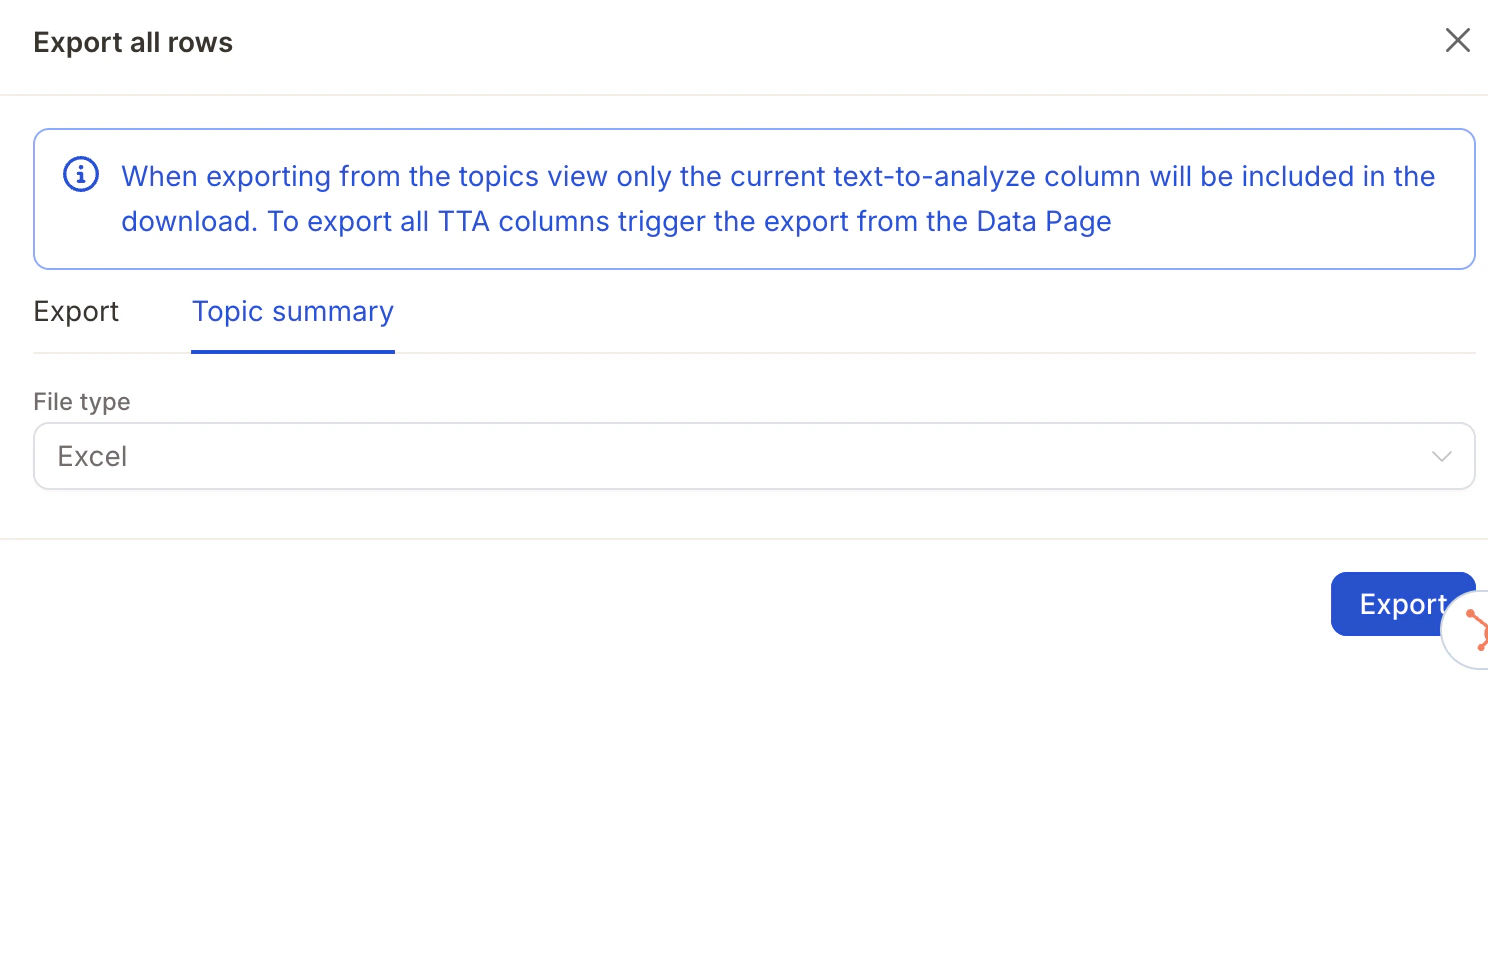
Exporting with filters
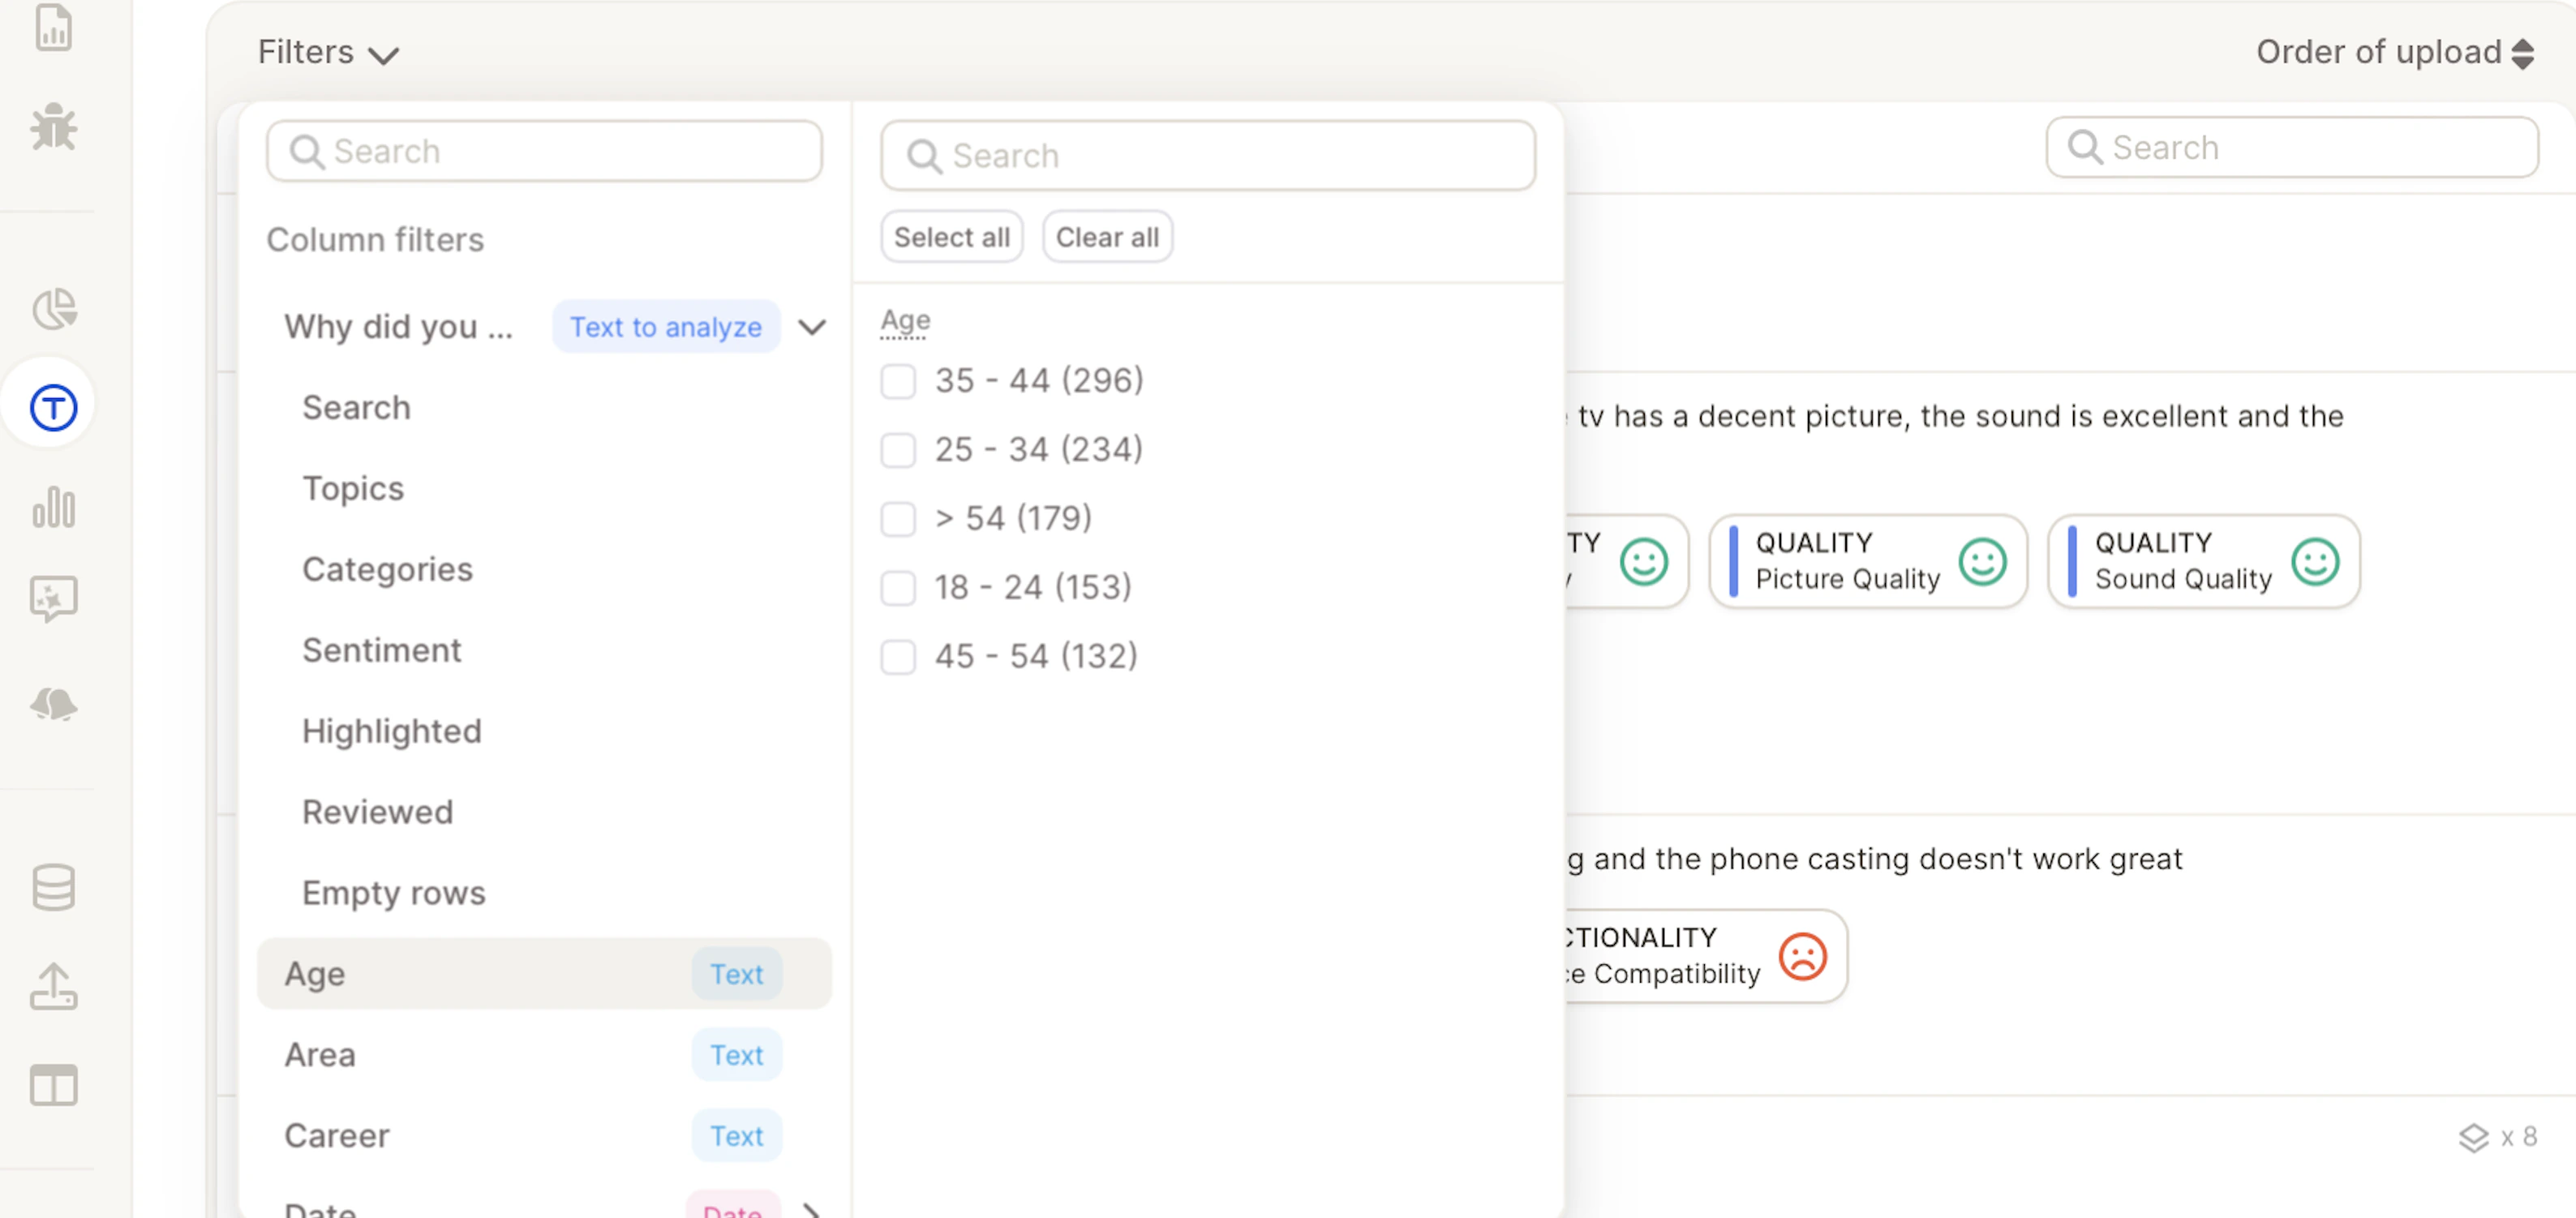
- Topics & Categories
- Sentiment
- Reviewed / Highlighted
- Demographics & other variables (Age, Gender, Area, etc.)
Topics in order of assignment
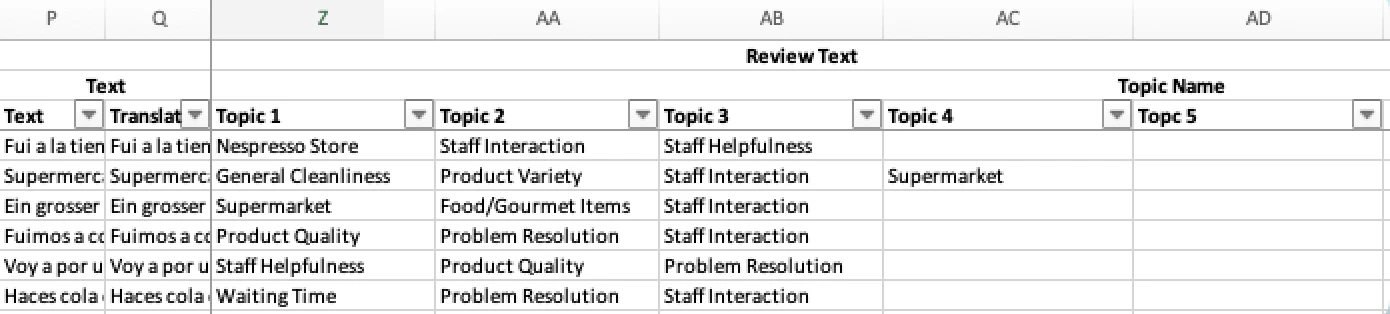
This is the most commonly used format and the one you’ll see by default. Each response is represented by a single row. Topics are placed in Topic 1, Topic 2, Topic 3… columns in the order they were assigned (manually or by AI). If a response has fewer topics, later columns will remain empty — that’s normal.\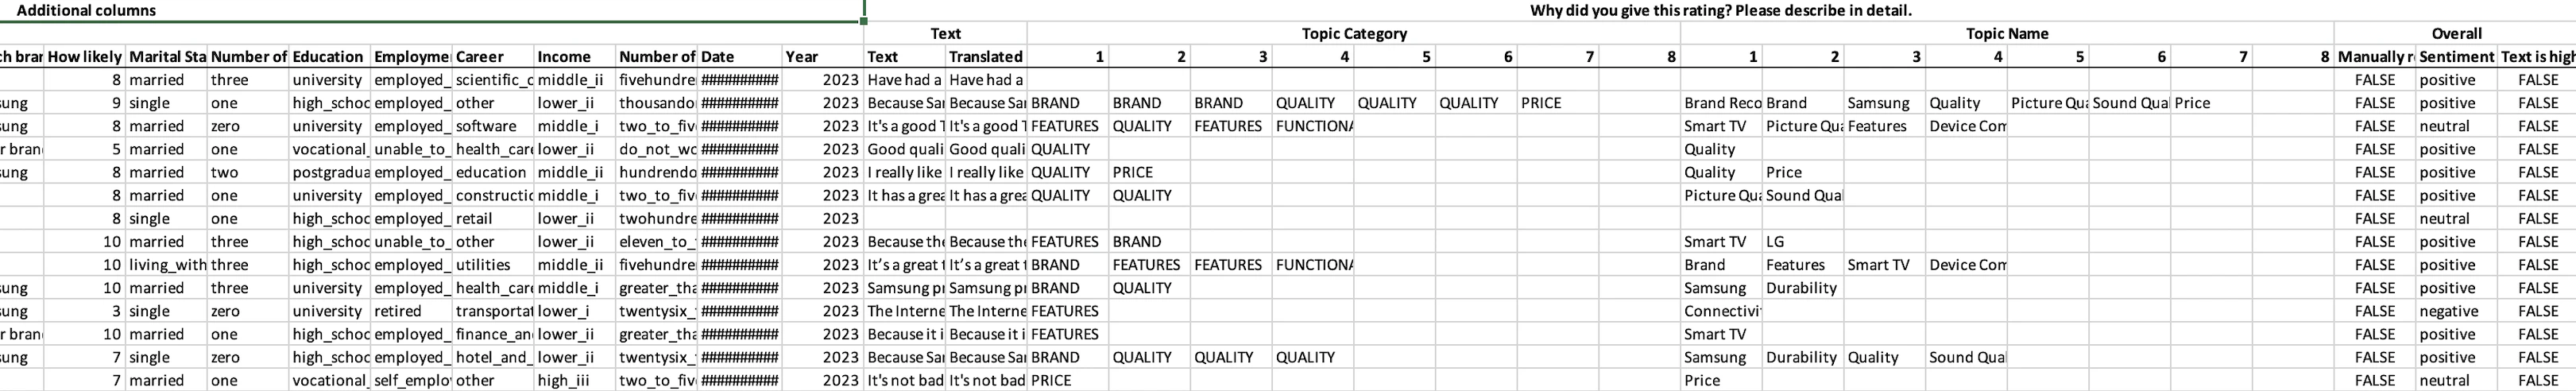
Topics in order of appearance
This format mirrors how respondents expressed themselves. Topics are shown in the exact sequence they appeared in the original text. Each topic is exported as a pair: Topic Category + Topic Name. If a verbatim contains many topics, they’ll stretch across multiple column pairs.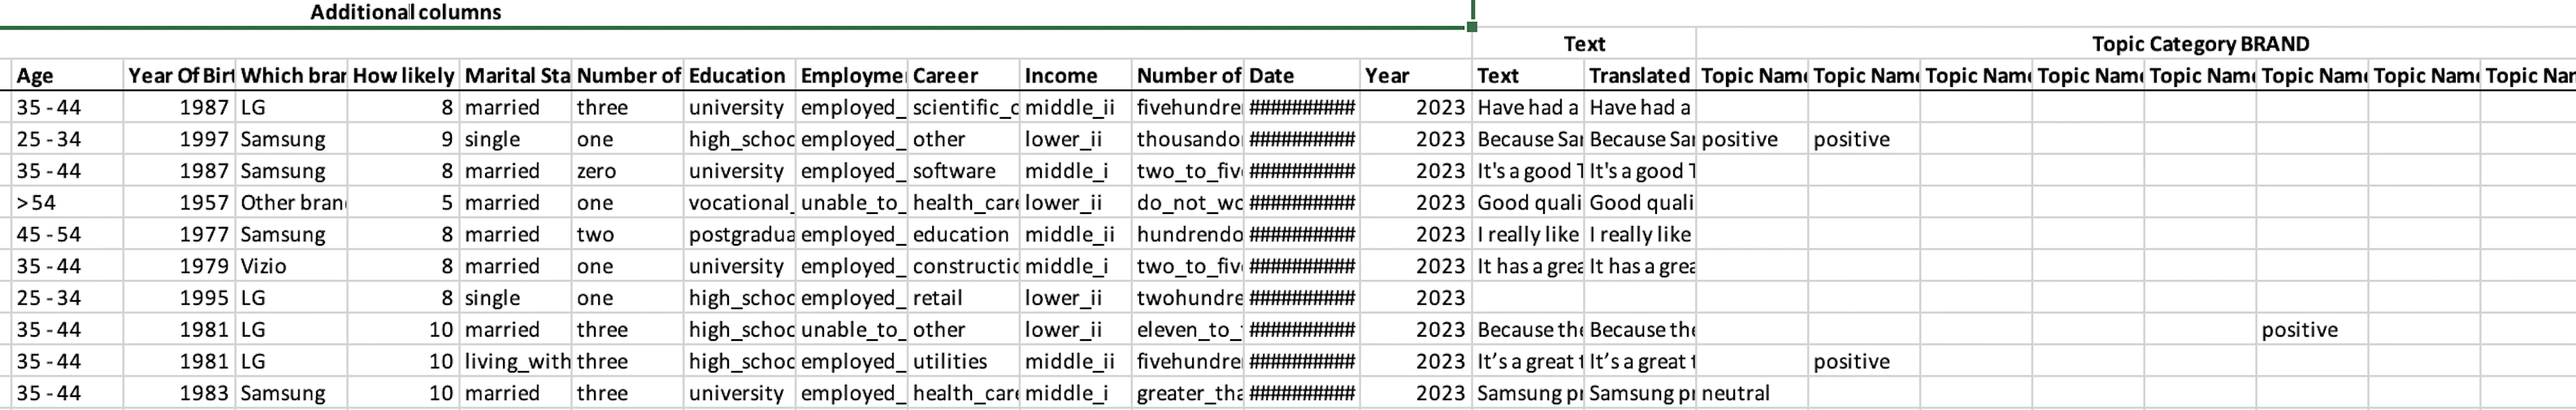
BI Tool export
Caplena allows you to seamlessly connect and analyze your data in your preferred BI tools like Power BI, Looker, and Tableau. This guide explains how to export your Caplena data and connect it to those platforms using BigQuery.Step 1: Choose your data format
You’ll be asked to choose between two formats: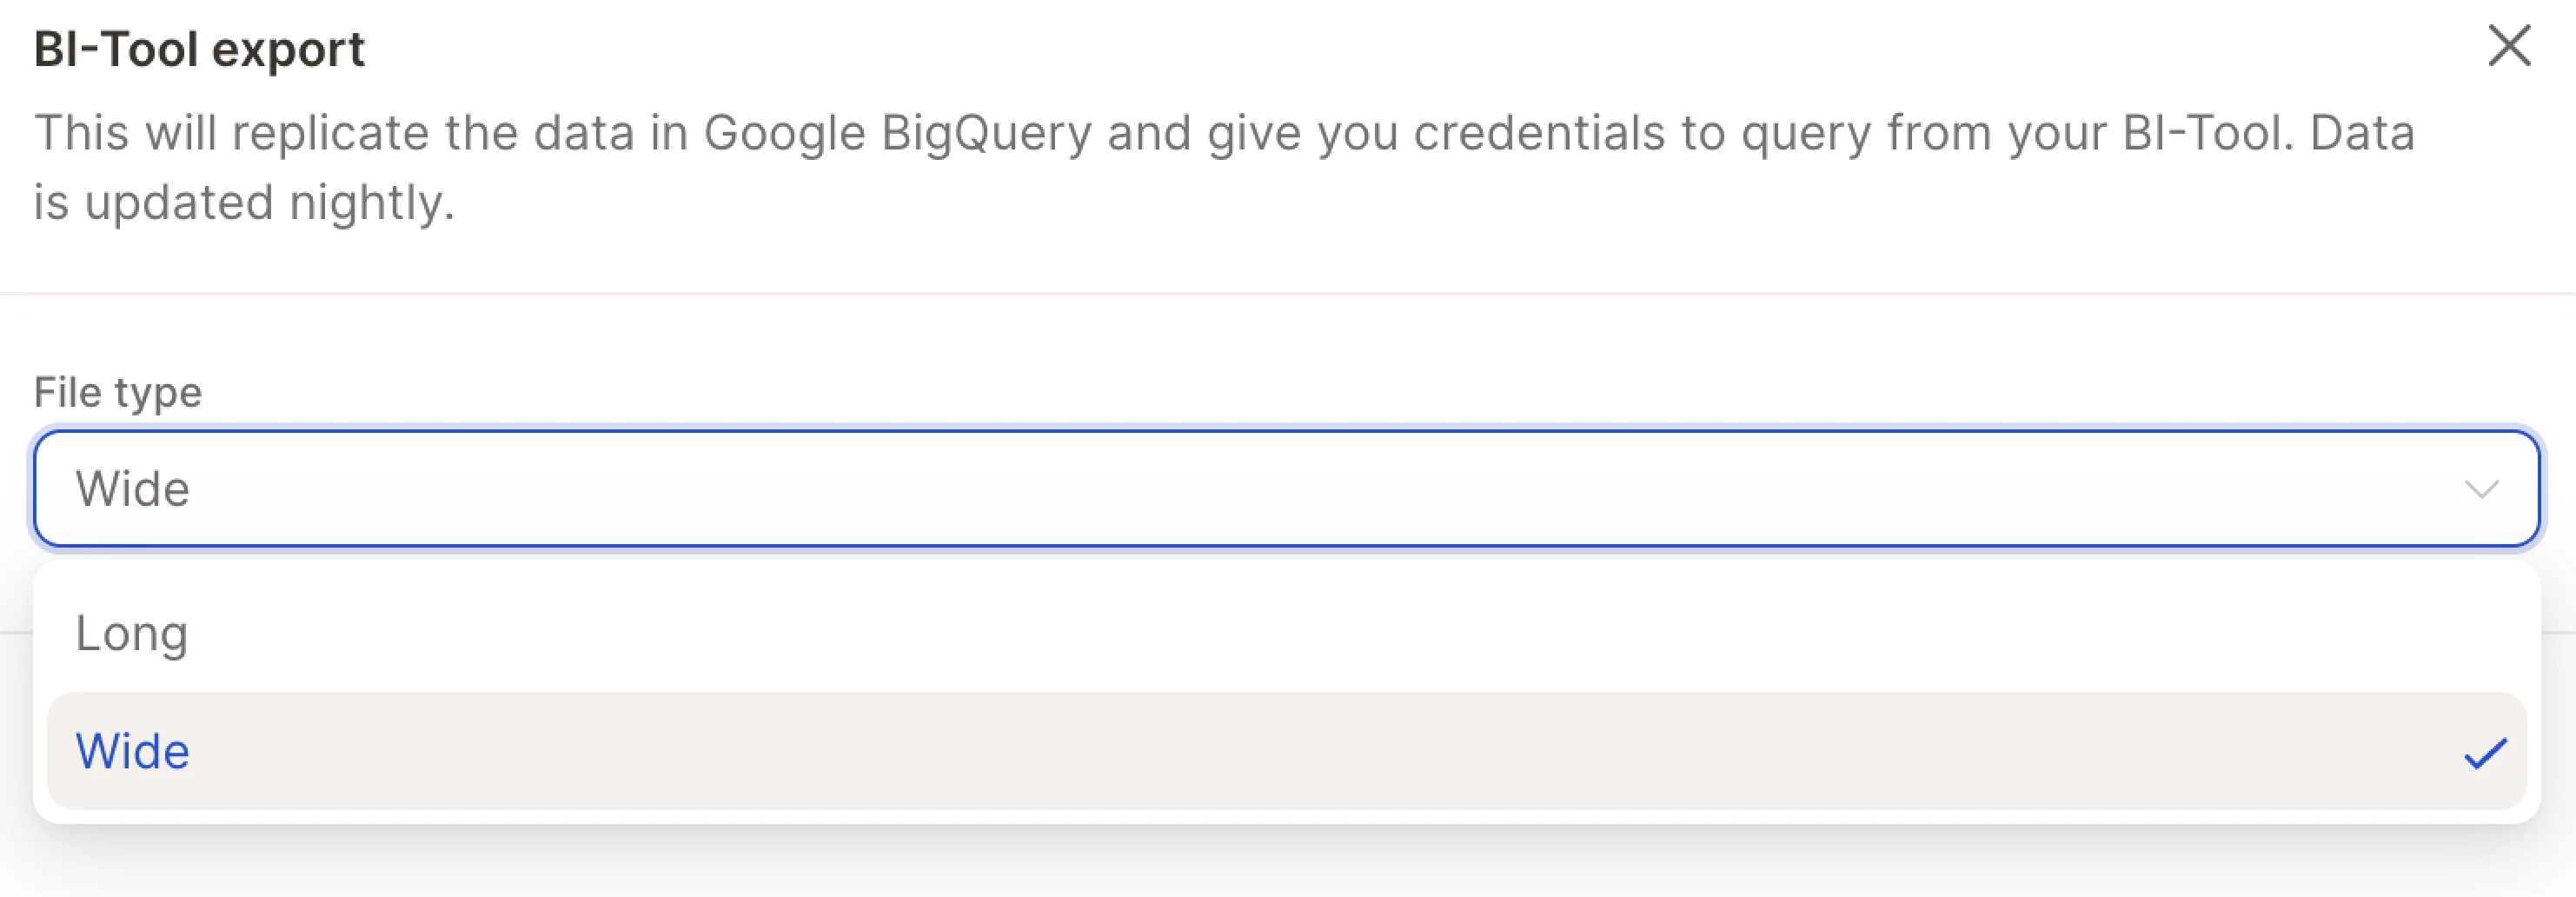
- Long Format — Ideal for working with open-ended text and topic analysis. Each row represents a single topic assignment per response.
- Wide Format — More suitable if you’re comfortable using Power Query or SQL. All topics are returned in a single row with multiple columns or as arrays.
The exported data is updated nightly, so if you make changes in Caplena (e.g., assign new topics), those updates will be reflected the next day.
Step 2: Access your export credentials
Once the export is ready, you’ll be provided with: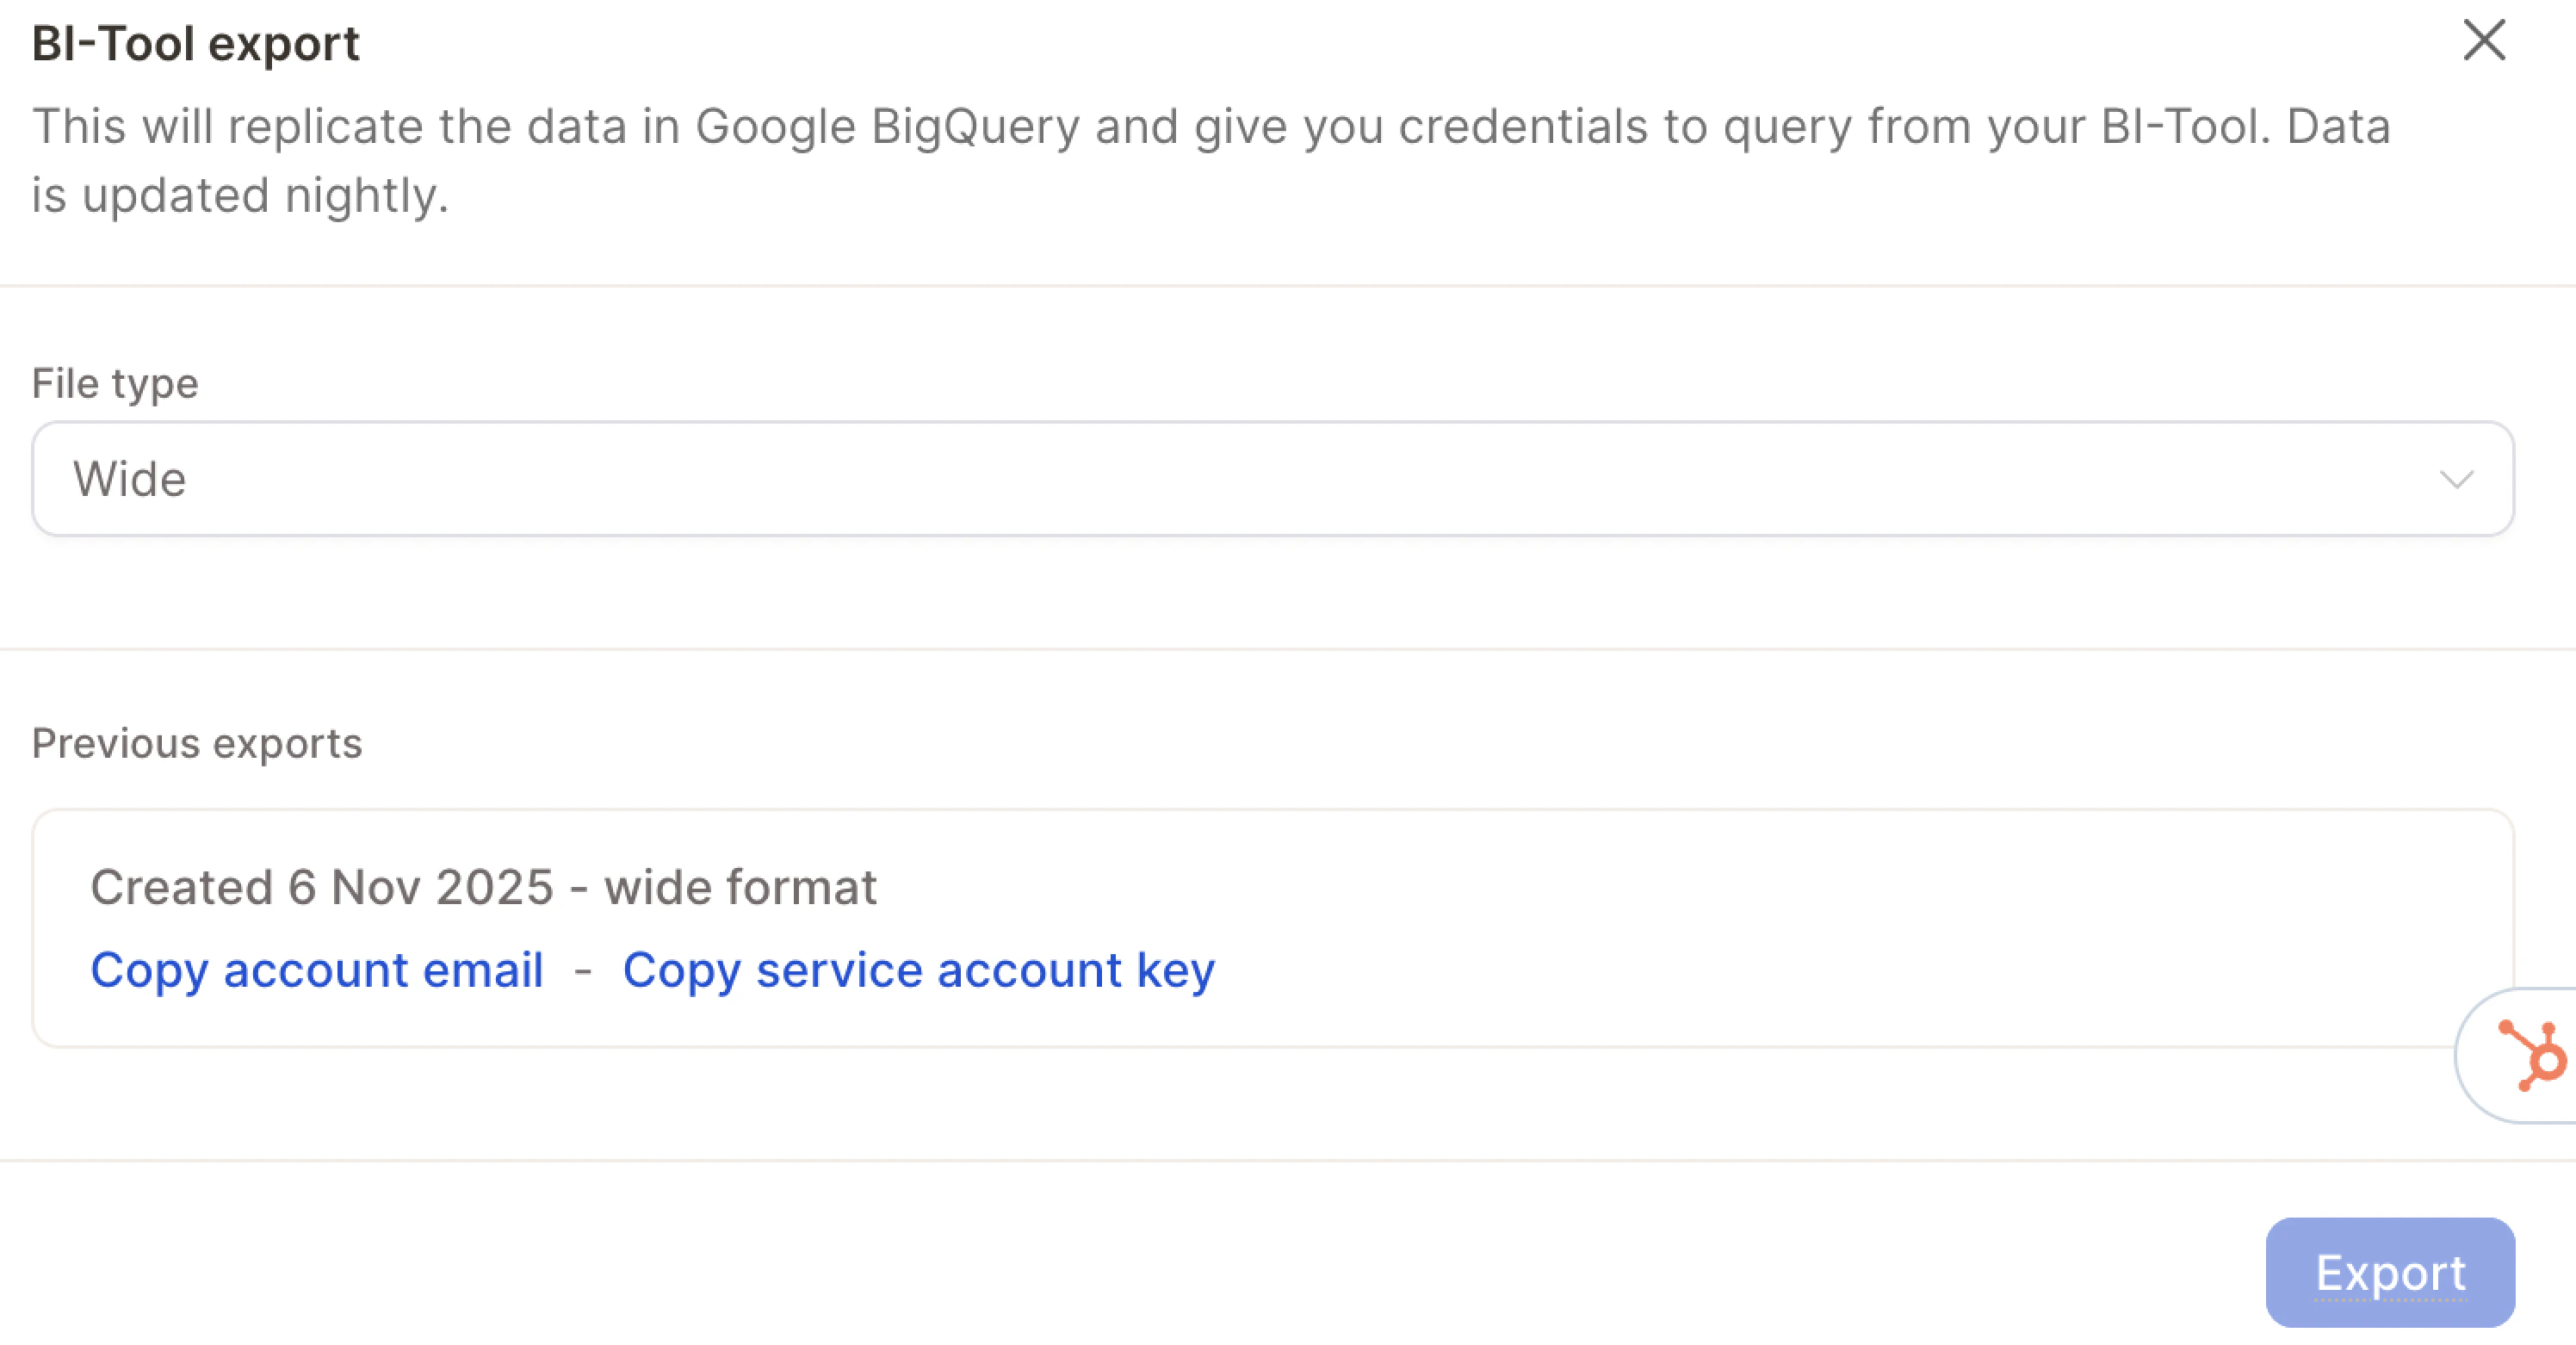
- Account Email
- Service Account Key
Step 3: Connect your BI tool
Power BI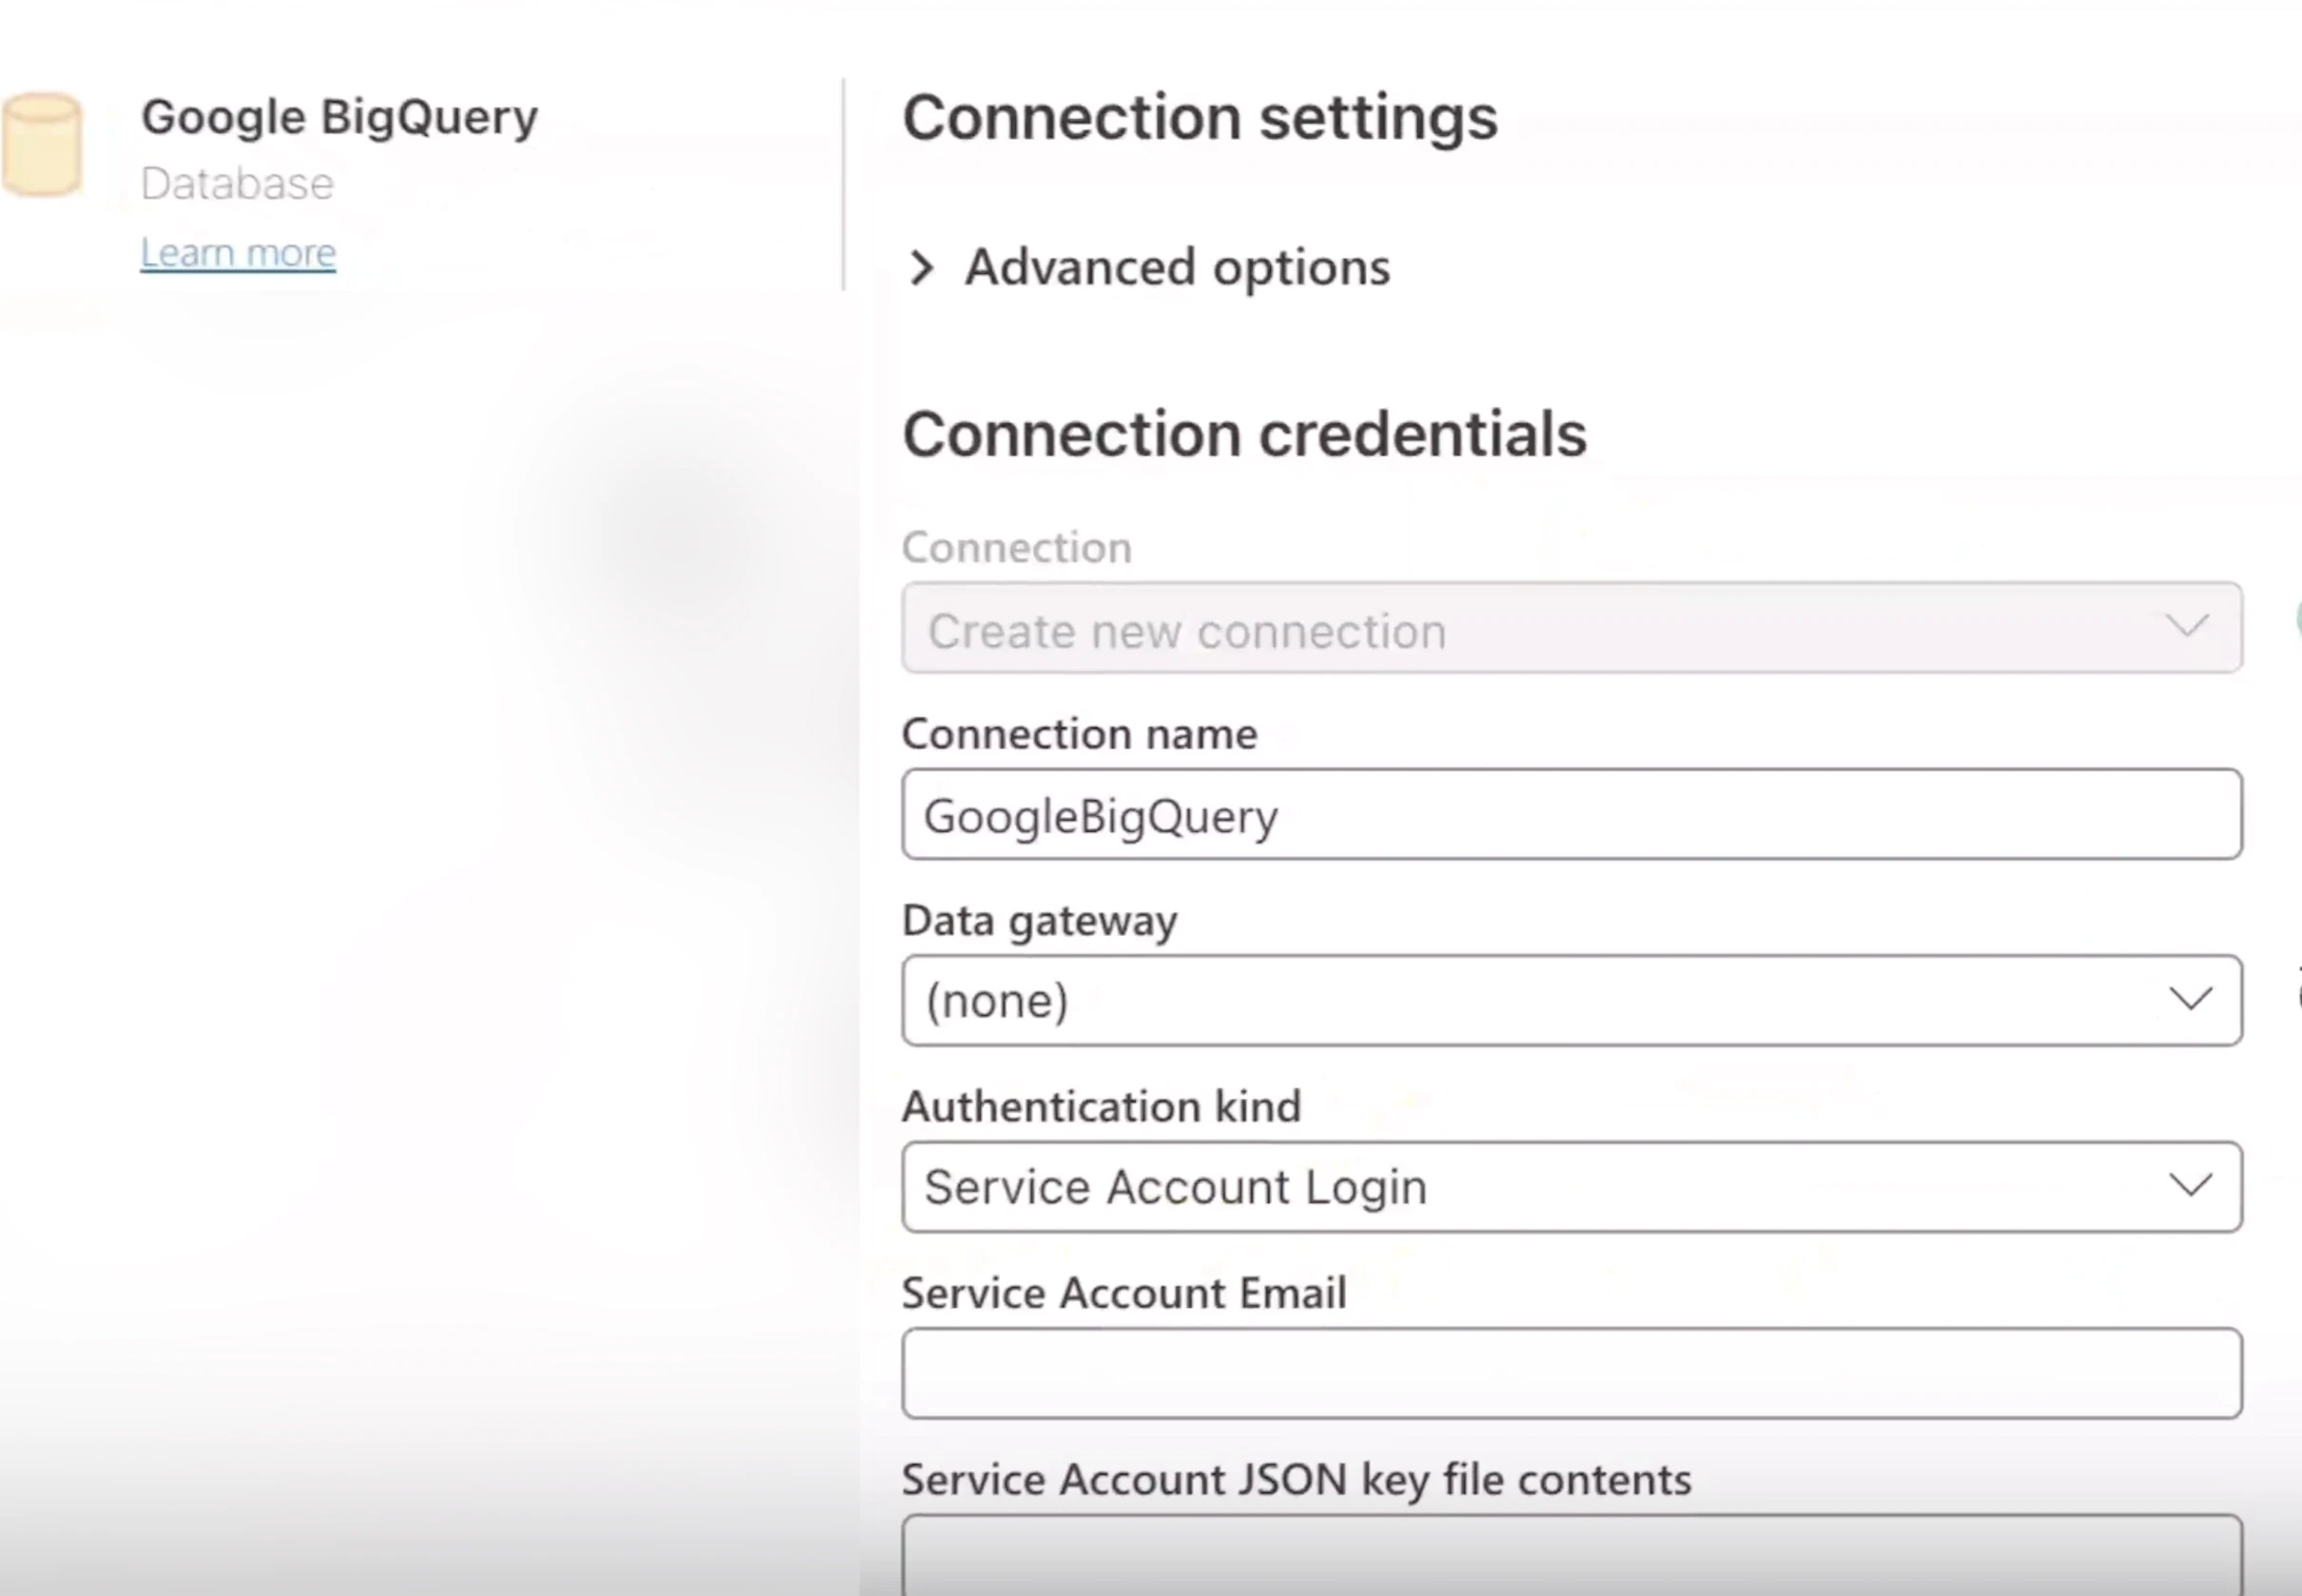
- Open Power BI and go to Power Query (via Dataflows or the Desktop App).
- Click Add data source and search for BigQuery.
- Create a new connection using the Account Email and Service Account Key from Caplena.
- After authentication, navigate to your dataset. It will appear with a name such as
project_960_long_format(or similar).
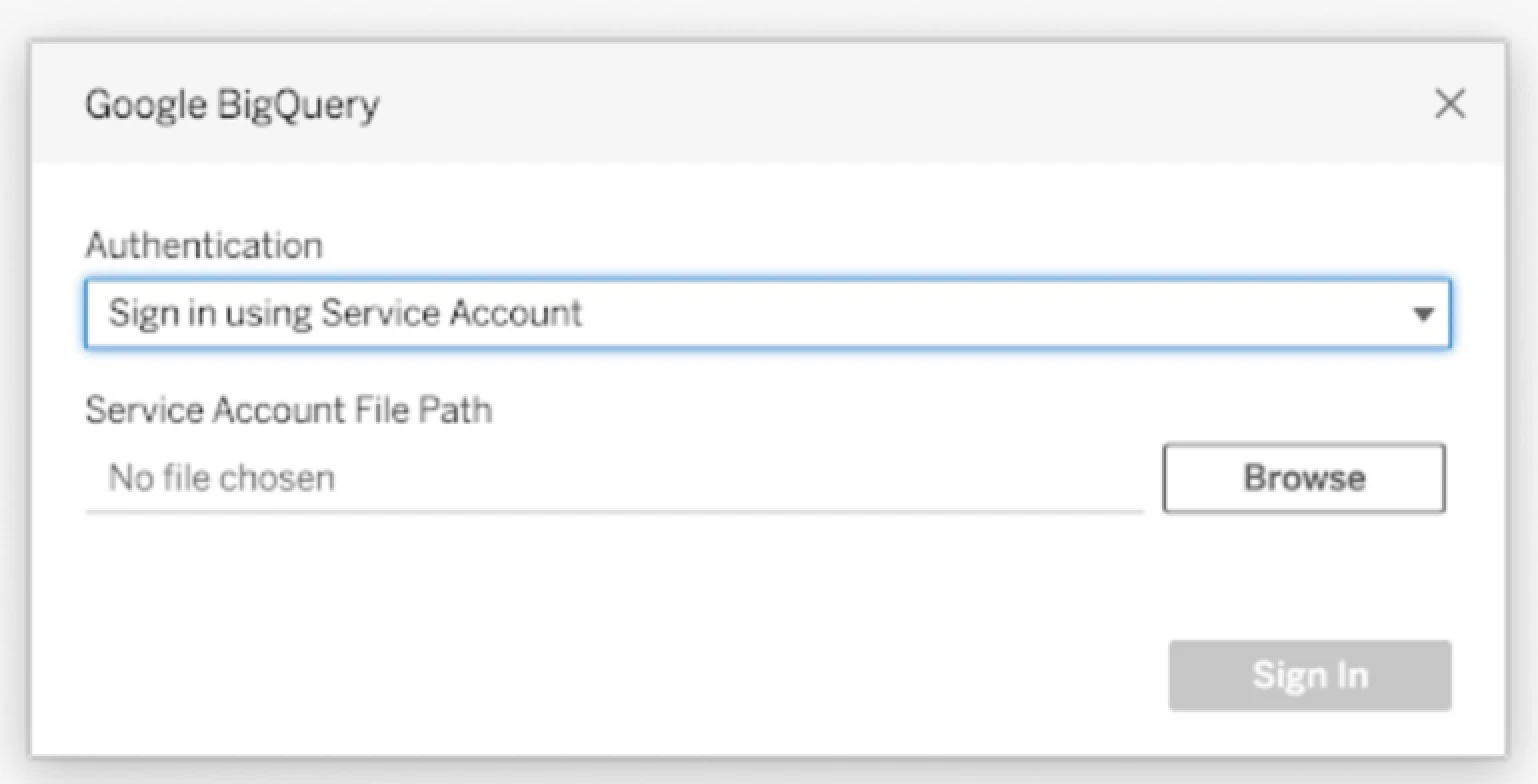
- In Authentication, choose Sign in using Service Account (JSON).
- Upload the
.jsonkey file. - Click Sign In and authenticate.
- Click Accept to grant access.
Step 4: Understand the long format structure
In long format:- Each response may appear in multiple rows, one for each topic assigned.
- Repeated columns (like respondent ID, submission date, or other variables) will remain the same across rows.
- Each row includes:
- A topic label
- The sentiment assigned
- The full response text (if included)
- Any other quantitative variables (e.g. brand, date, source)
| Topic | Sentiment |
|---|---|
| Price | Negative |
| Coverage | Negative |
Step 5: Build your visualizations
Now that the data is available in your BI tool, you can start building visualizations:- Bar charts of top topics by volume
- Sentiment trends over time
- Filtering by brand, wave, or product line
In long format, duplicate rows for multiple topics may affect calculations like averages or NPS scores. If needed, use de-duplication logic or switch to wide format to avoid duplication.