The Net Sentiment Score is a key metric used to measure the overall sentiment of your text data. Each comment is classified as positive, negative, or neutral based on its content and the topics assigned to it. This classification follows the same principles as the Net Promoter Score (NPS), providing a simple and effective way to understand the general sentiment of your feedback.Documentation Index
Fetch the complete documentation index at: https://docs.caplena.com/llms.txt
Use this file to discover all available pages before exploring further.
How Is the Net Sentiment Score Calculated?
The formula is simple:Net Sentiment Score = % Positive – % NegativeThis results in a score ranging from:
- +100 → all responses are positive
- 0 → equal balance between positive and negative
- –100 → all responses are negative
🔴 A lower score suggests a predominance of negative sentiment
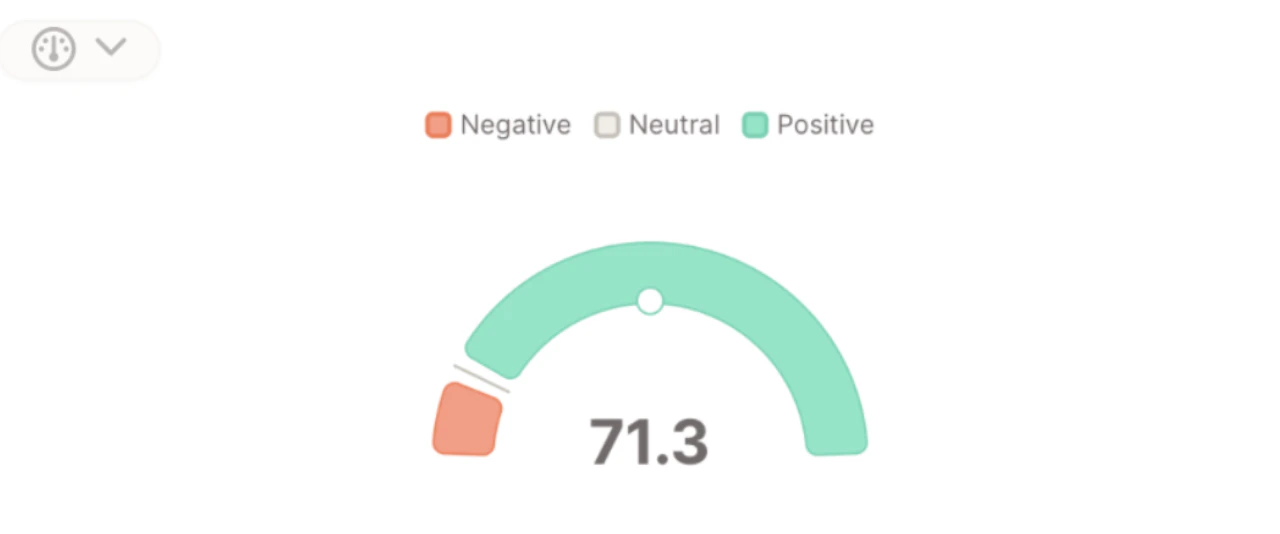
- 84.5% of comments are classified as positive
- 13.2% are negative
84.5 – 13.2 = 71.3
Visualizing Net Sentiment
There are two ways to visualize Net Sentiment in Caplena using Insight Elements:1. Net Sentiment (Gauge + Summaries)
- A gauge displaying the current score
- An AI-generated Positive Sentiment Summary
- An AI-generated Negative Sentiment Summary
Best for one-time reports, dashboard overviews, and highlighting what customers like or dislike.
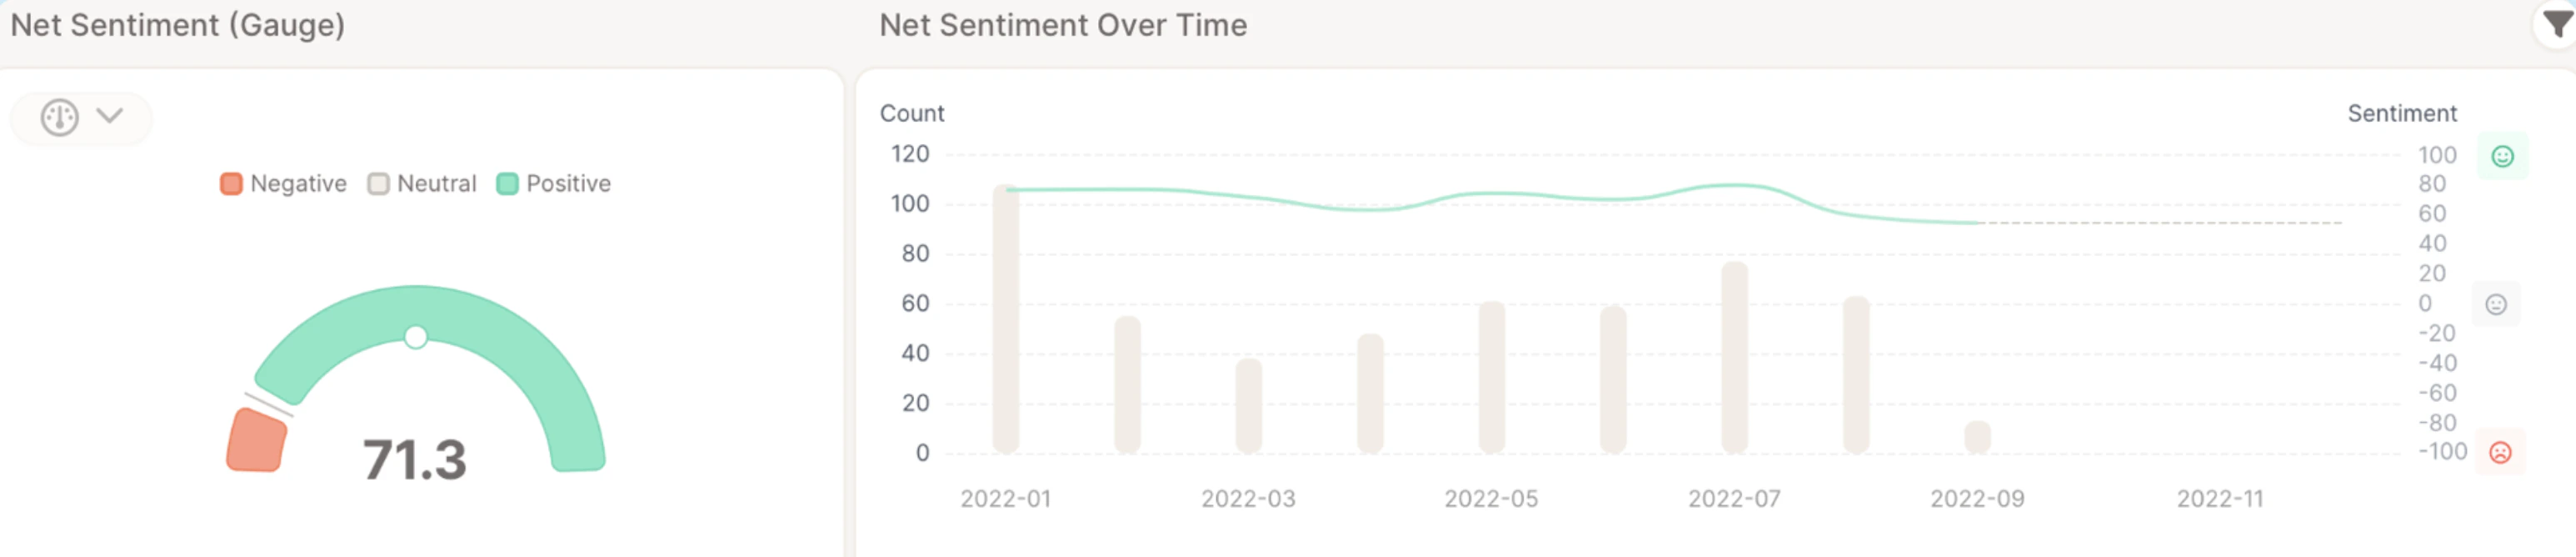
2. Net Sentiment Over Time
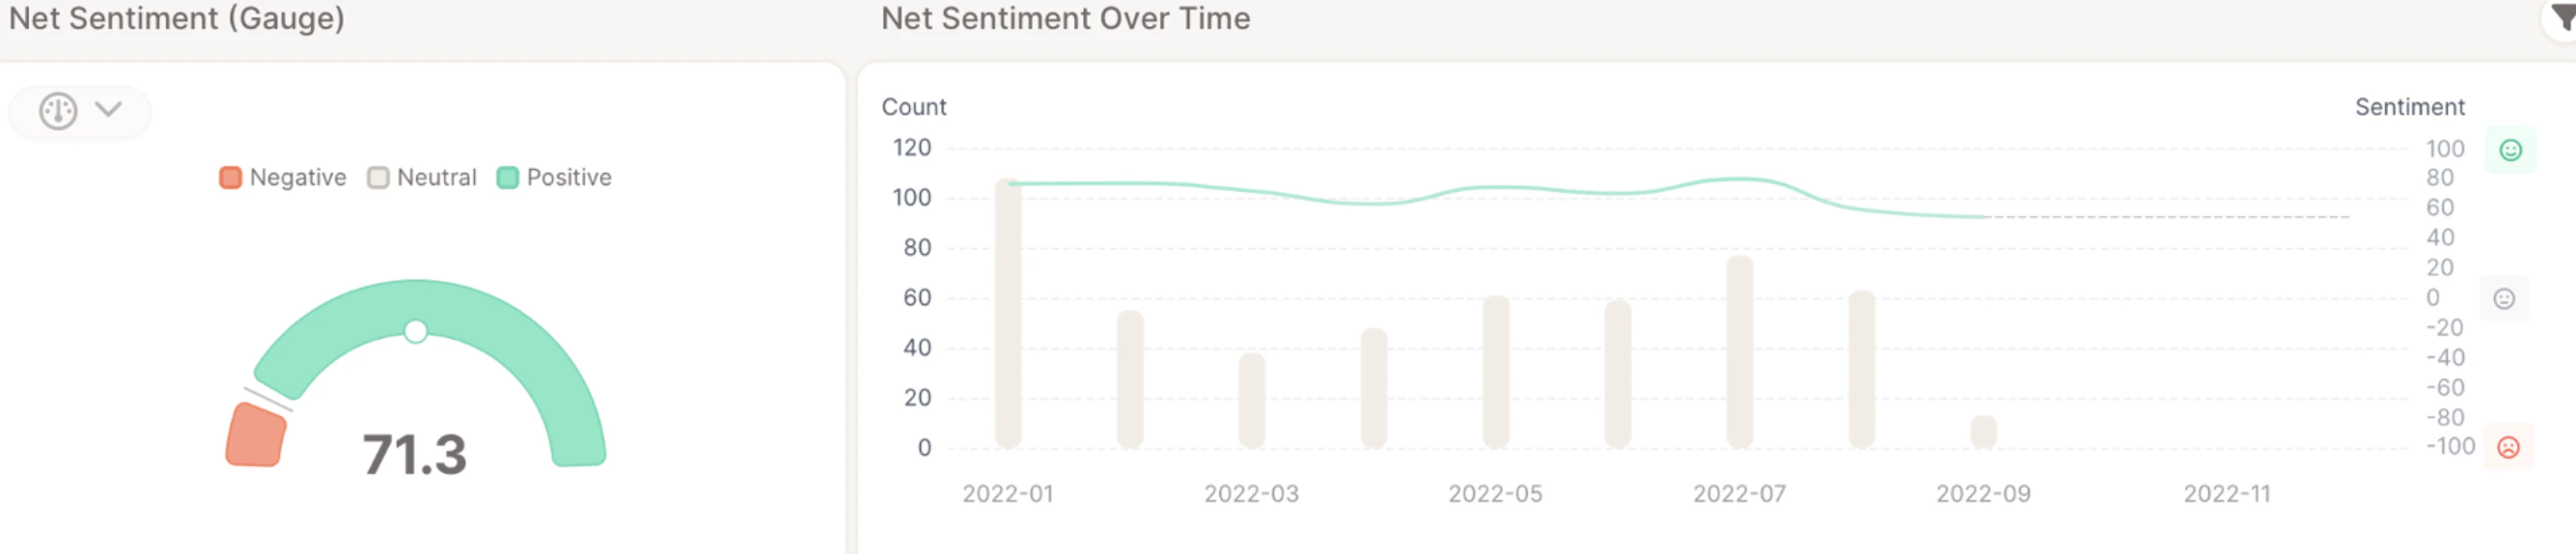
- A gauge displaying the current score
- A line chart showing how sentiment changes over time
Best for tracking sentiment development over time or identifying turning points in customer perception.
Use Cases
Use the Net Sentiment Score to:- Benchmark overall customer sentiment
- Track emotional tone over time (with date variable)
- Supplement or replace metrics like NPS or CSAT